Cryostat Liquid Nitrogen boil-off rate measurements.
A passive "rotameter" type flow-meter (ball in tapered tube) was found to be sensitive enough to measure the liquid nitrogen (LN2) boil-off rate of a cryostat, leaving enough headroom for fault conditions. Since the boil-off flow-rate of a cryostat is a direct indication of the state of its vacuum or the presence of excessive heat generation inside the cryostat, a measure of this can be used as a diagnostic tool for faultfinding. If the size of the LN2 tank is known, the projected hold time can also be calculated from the knowledge that 1 litre of LN2 produces 648 litres of nitrogen gas.
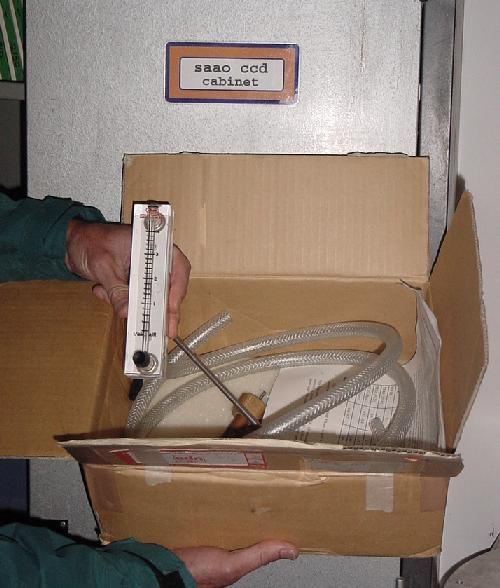
The flow-meter together with all the necessary fittings and pipes to connect to all the different cryostats in Sutherland are being stored in a box in the CCD cupboard on the 40" observing floor - see pictures below.
Since the array of cryostats used at SAAO all differ somewhat in design, heat load, etc., the boil-off rates under non-fault conditions had to be known first to get an idea of normal conditions. Some of these were measured before using an old gas consumption meter and actual values using the rotameter were taken lately. Typical values are given below. All measurements were with systems powered up (CCD's at controlled temperature where applicable), enough time allowed for the system to stabilise (eg. after a fill) and with the system stationary.
CCD System |
Typical flow-rate (l/min) |
LN2
tank-size (litre) |
Projected hold time (Hours) |
Notes see below |
Lab
measured hold time (Hours) * |
CCD
@ temp. (Hours) ** |
CCD Control Temperature (Kelvin) | CCD
base- temperature (Kelvin) *** |
| IRP II | 0.2 - 0.3 | Note 1 | ||||||
| IRP III | 0.4 | Note 1 | ||||||
| TEK6 (10242 - GIRAFFE) | 1 - 1.2 | 1.5 | 13 - 16 | Note 2 | >13 (~12 on side) | 1.5 | 180 | 155 |
| TEK8 (5122) | 0.5 - 1.5 | 1.5 | 11 - 32 | Note 3 | 180 | |||
| SIT1/2 (1752 x 532 - Old SpCCD) | 0.55 - 0.8 | 1.28 | 17 - 25 | 23 (18 @ 45°) | 2.5 | 180 | 165 | |
| STE3 (5122, Green) | 0.3 - 0.6 | 1.84 | 28 - 56 | Note 4 | 28 | 3 | 180 | 148 |
| STE4 (10242, Blue) | 0.6 - 0.7 | 1.84 | 28 - 33 | Note 4 | 28 | >3 | 180 | 152 |
| SpUpNIC (2048 x 512 - New Spectrograph CCD) | 0.3 - 0.6 | 1.42 | 51 - 25.5 | Note 4 | 34
(lab), 29.75 (Suth) |
3.5 | 168 | 150 |
* The typical hold time of a system is the time as measured in the lab in its normally used orientation (eg. inverted or upright) with the chip controlled at its working temperature, Zeolite/charcoal intalled, etc.
** The time taken for the CCD (the Cu-block actually) to reach its operation temperature (mostly 180K) after being cooled with LN2, starting from room temperature.
*** The natural temperature the CCD reaches when the temperature control servo is switched off (ie. cu-block not heated).
Notes:
Factors influencing the flow rate.
The flow rate values listed above give the best and worst rates measured so far and should be treated as a guideline to the normal values you could expect. If you find measurements outside this range, please note down the circumstances so that our database can be improved. We are particularly interested in flow-rates under fault conditions - only one instance for TEK6 has been measured yet.
When interpreting a high flow reading, trying to decide the cause, keep the following in mind:
|
View of the "Flow Measurement Kit", kept in the CCD Cabinet (seen in the background) on the 40" observing floor. Note that the flow meter used for DandiCam is also kept in this cupboard and can be recognised by the marking: "litres/day" - the correct flowmeter to use is the 4 l/min Air as in this picture. |
|
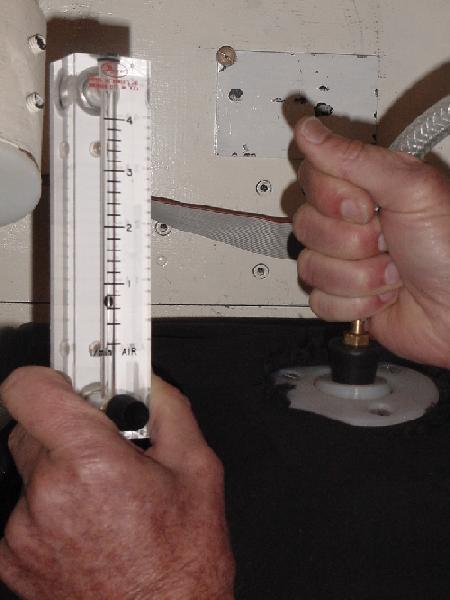
This picture shows a flow measurement being taken on the (old) Spectrograph Cryostat (SIT1/2) giving a typical flowrate of 0.7 l/min. Note that due to the cryostat neck clamp, the standard IR-Labs fitting cannot be screwed to the cryostat and the rubber bung fitting for DandiCam was used instead. |
|
Date. |
Time. |
Flow-rate. (l/min) |
Hours since last LN2 fill. | Days since last pump-down. |
| 27/5/1999 | 11H30 | 0.4 | ±19 | 4 |
| " | 12H30 | 0.4 | ±20 | 4 |
|
Date. |
Time. |
Flow-rate. (l/min) |
Hours since last LN2 fill. | Days since last pump-down. |
| 28/5/1999 | 10H45 | 0.2 | ±21 | 5 |
| " | 11H30 | 0.25 | ±22 | 5 |
| " | 14H30 | 0.3 | ±24 | 5 |
|
Date. |
Time. |
Flow-rate. (l/min) |
Hours since last LN2 fill. |
Days since last pump-down. |
| ? | 11H20 | 1.1 | 2 | 2 |
| " | 14H35 | 1 | 5.5 | 2 |
|
Date. |
Time. |
Flow-rate. (l/min) |
Hours since last LN2 fill. |
Days since last pump-down. |
| 10/2/1998 | 09H00 | 0.9 | 10 | ? |
| " | 15H00 | 0.75 | 10 min | ? |
| 11/2/1998 | 09H30 | 0.9 | 10 | ? |
| " | 14H00 | 0.95 | 14 | ? |
| 9/3/1999 | 09H20 | 0.95 | 1 | 1 |
| " | 11H20 | 0.95 | 3 | 1 |
| " | 14H50 | 0.96 | 14.5 | 1 |
| " | 16H00 | 1 | 7 | 1 |
| 29/3/1999 | 14H10 | 2 | 10 min | 10 min |
| " | 14H45 | 1.6 | 45 min | 45 min |
| " | 15H25 | 1.2 | 1.5 | 1.5H |
| " | 16H25 | 1.1 | 2.5 | 2.5H |
| 30/3/1999 | 09H30 | 0.9 | 1.3 | 1 |
| " | 12H45 | 0.8 | 4.5 | 1 |
| " | 14H15 | 0.65 | 6 | 1 |
| " | 16H00 | 0.5 | 8 | 1 |
| 31/3/1999 | 12H25 | 1.2 | 4 | 2 |
| " | 14H15 | 1.5 | 6 | 2 |
| " | 15H35 | 1.5 | 8 | 2 |
| 1/4/1999 | 11H30 | 1.3 | 3.5 | 3 |
| " | 12H10 | 1.3 | 4 | 3 |
| " | 12H55 | 1.4 | 5 | 3 |
| " | 14H00 | 1.4 | 6 | 3 |
| " | 16H20 | 1.4 | 8 | 3 |
|
Date. |
Time. |
Flow-rate. (l/min) |
Hours since last LN2 fill. |
Days since last pump-down. |
| SIT2 14/8/1996 | 16H17 | 0.595 | ? | ? |
| SIT1 26/5/1999 | 11H10 | 0.75 | 3 | 9 |
| " | 12H15 | 0.7 | 4 | 9 |
| " | 13H05 | 0.7 | 4.5 | 9 |
| " | 15H05 | 0.6 | 6.5 | 9 |
| " | 15H55 | 0.6 | 7.5 | 9 |
| " | 16H15 | 0.6 | 8 | 9 |
| " | 16H45 | 0.7 | 0.5 | 9 |
| 27/5/1999 | 08H50 | 0.55 | 24 | 10 |
| " | 09H15 | 0.7 | 25 min | 10 |
| " | 14H30 | 0.8 | 5.5 | 10 |
| " | 16H40 | 0.8 | 8 | 10 |
|
Date. |
Time. |
Flow-rate. (l/min) |
Hours since last LN2 fill. |
Days since last pump-down. |
| 28/1/1999 | 10H25 | 0.578 | ? | ? |
| " | 11H30 | 0.775 | ? | ? |
| 27/5/1999 | 09H45 | 0.7 | 2 | 12 |
| " | 11H30 | 0.6 | 4 | 12 |
| " | 14H00 | 0.6 | 6 | 12 |
| " | 14H20 | 0.7 | 20 min | 12 |
| 30/5/1999 | 11H00 | 0.6 | 3.5 | 15 |
|
Date. |
Time. |
Flow-rate. (l/min) |
Hours since last LN2 fill. |
Days since last pump-down. |
| 21/9/1999 | 14H00 | 0.5 | 20 | 1 |
| " | 16H00 | 0.4 | 22 | 1 |
| 22/9/1999 | 10H30 | 0.6 | 16.5 | 2 |
| " | 16H00 | 0.6 | 22 | 2 |
| 23/9/1999 | 16H00 | 0.6 | 24 | 3 |
| 1/11/1999 | ? | 0.3 | ~5 | ~5 |
|
Date. |
Time. |
Flow-rate. (l/min) |
Hours since last LN2 fill. |
Days since last pump-down. |
| 20/6/2015 | 09H00 | 0.3 | 16 | 1 |
| 02/7/2015 | 10H00 | 0.35 | 22 | 1 |
| 20/06/2016 | 0.3 | 2 | ||
| 04/07/2016 | 0.6 | ~28 | 17 |